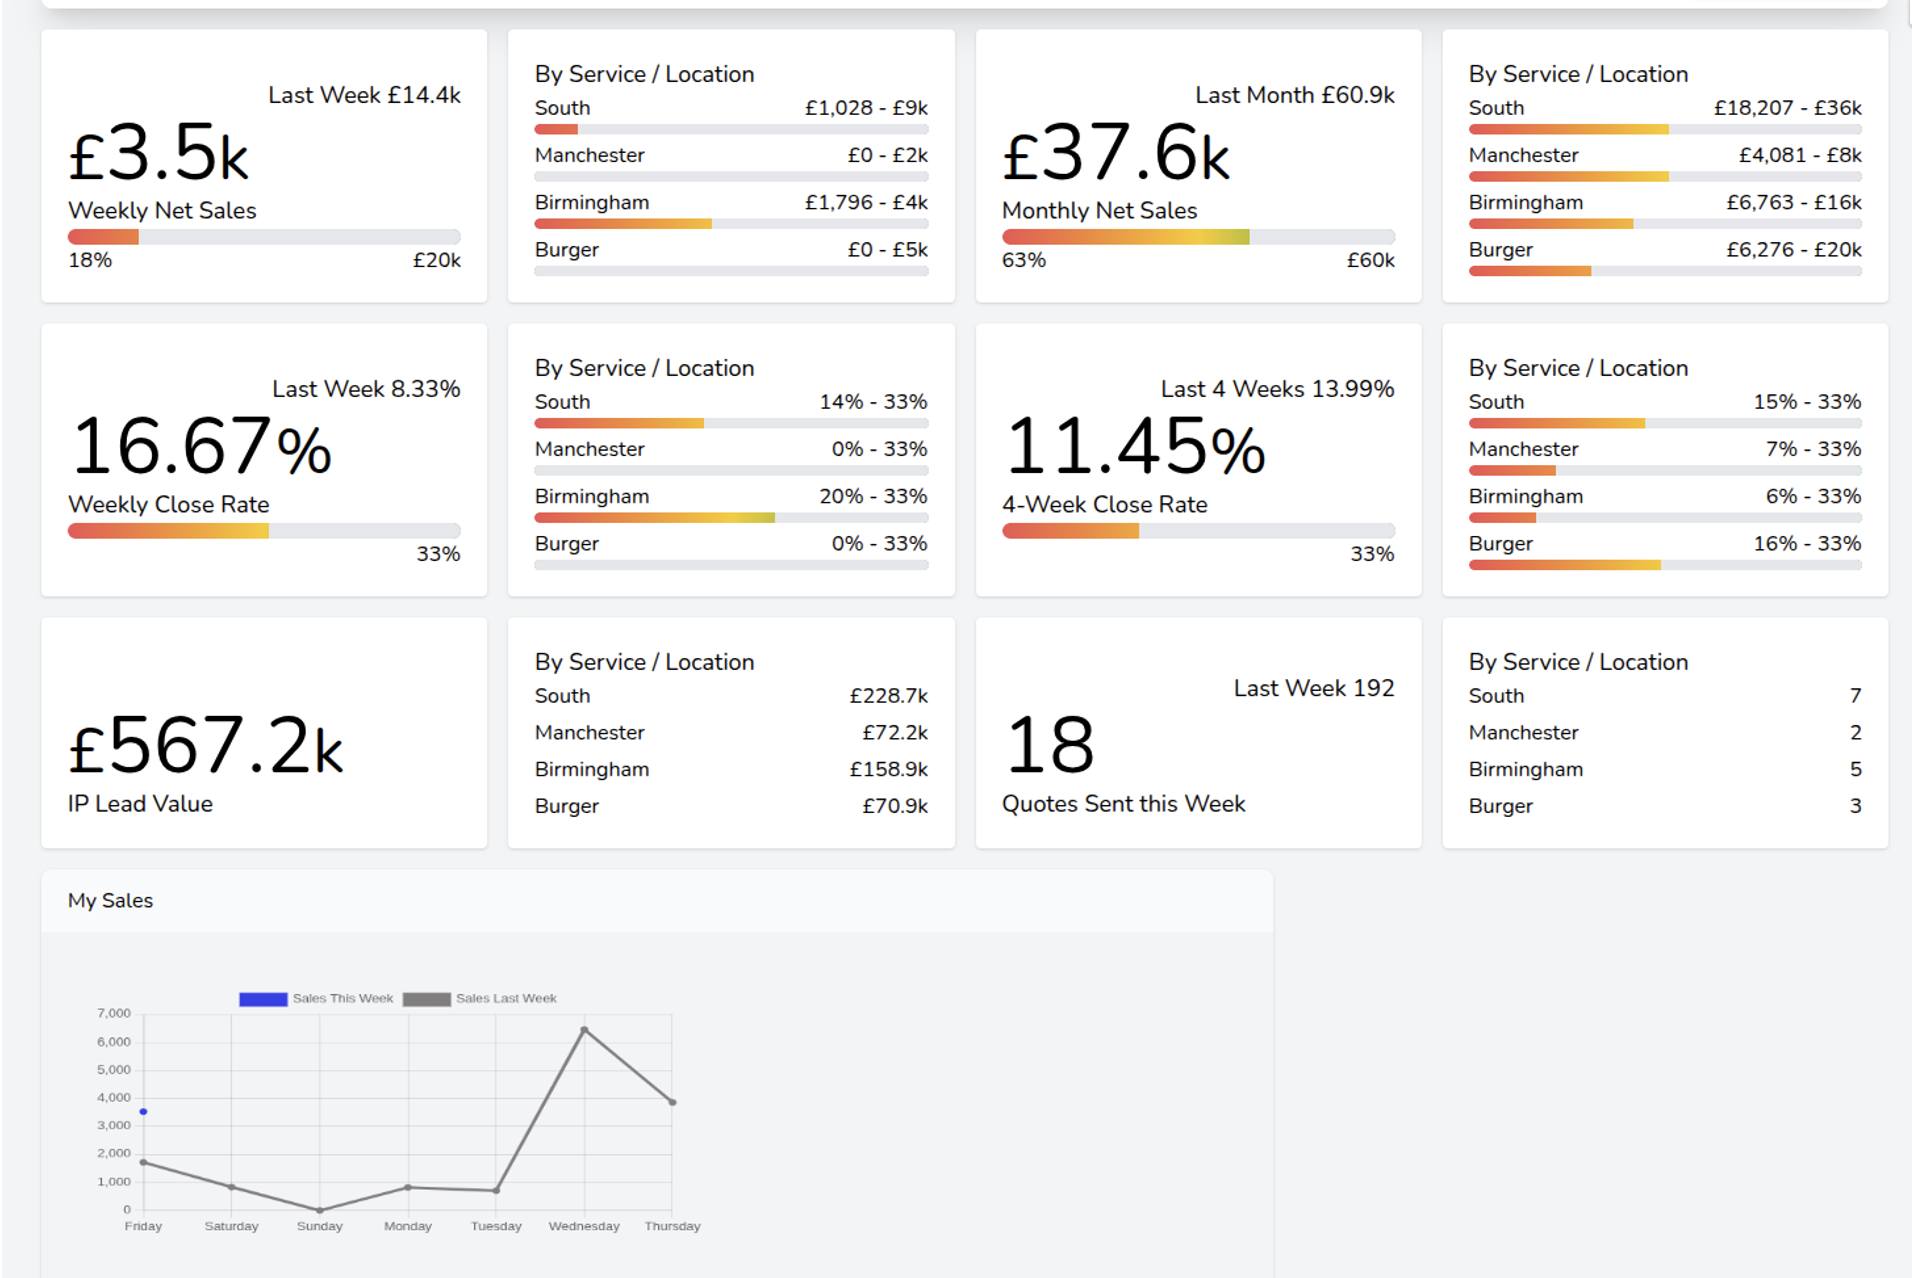
This custom sales dashboard has all the statistics in one place! This week’s sales compared with last week’s sales and the target for the week along with the progress bar.
In the second box, you can see the breakdown of the statistics by region. For each region you can also set sales targets. And have the thermometer indicating how far in the sales are at the moment.
Each sales number is rounded to the closest thousand. At the bottom of the screen, you get a visualisation of sales team performance for this week compared to last week.