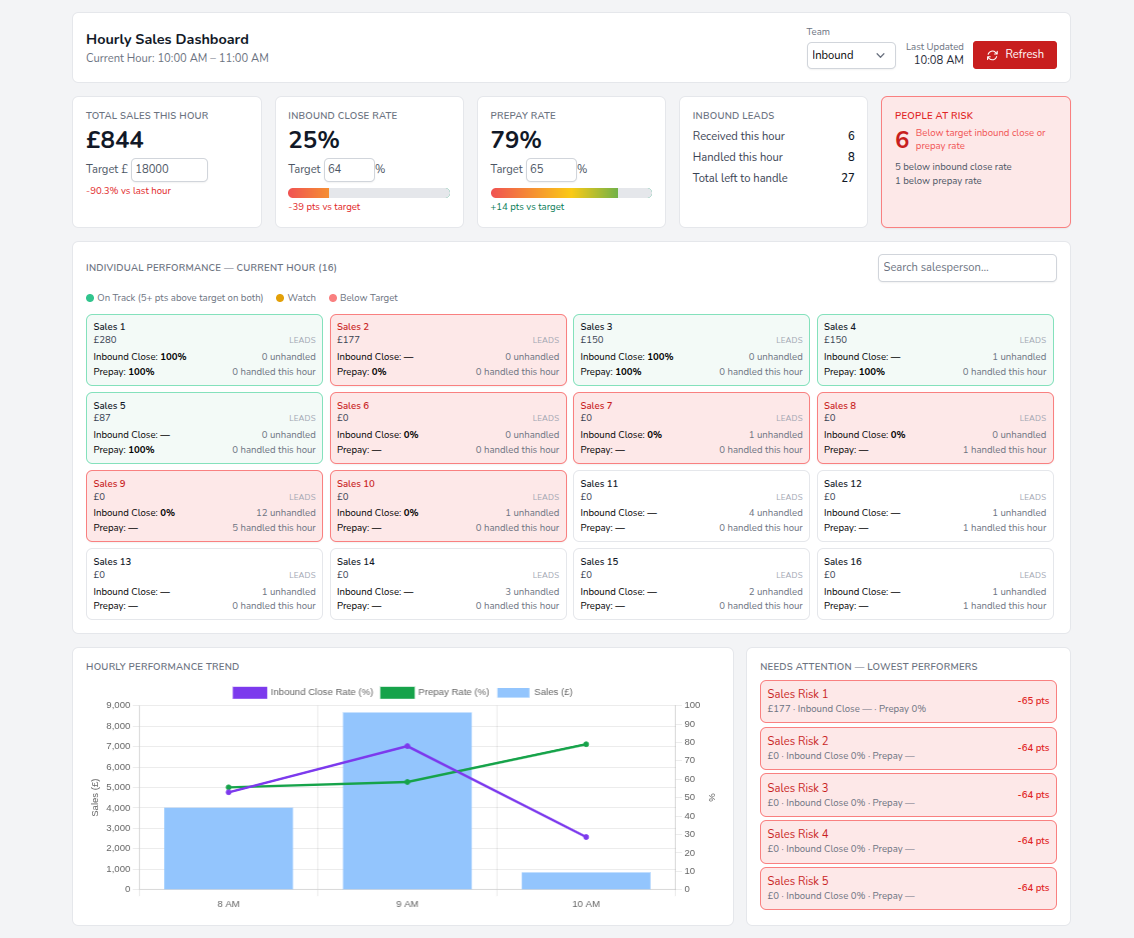
Our client previously had a statistics dashboard showing sales for each day. This was useful but did not allow them to monitor sales each hour. To be able to review how each salesperson is doing throughout the day and quickly remedy the situation, we were asked to build an hourly sales statistics dashboard.
The hourly sales dashboard shows three main statistics: the sales value, the close percent, and the percent of sales that were paid ahead. These are the numbers the client particularly requested. The top row shows statistics overall, with the ability to set targets. For higher visibility, current numbers are compared to the target via the heat indicator going from red to green.
The middle row provides a breakdown for each salesperson. Each salesperson is visually highlighted to show whether they are on target or are behind.
The bottom row graphs each statistic for today per each hour. And lists salespeople who are most behind on their sales.
The new hourly sales dashboard automatically refreshes regularly to allow for easy tracking.
Outcome:
- saved time manually tracking hourly statistics;
- increased visibility of each salesperson’s work;
- nicely visualised sales to understand the sales situation at a glance!